The Three "Percent Complete" Metrics Every Construction Project Needs to Track
May 28, 2026
When a construction project is in trouble, there is almost always a moment where someone saw it coming but did not have the data to prove it. The job felt off. The cost was running ahead of where it should be. The billings were lagging. The schedule was slipping.
Each of those feelings corresponds to a specific number. And when you put those three numbers side by side, the story becomes impossible to ignore.
These numbers are "percent complete" numbers, and there are three of them that every project should be tracking at the same time.
The three "percent complete" numbers
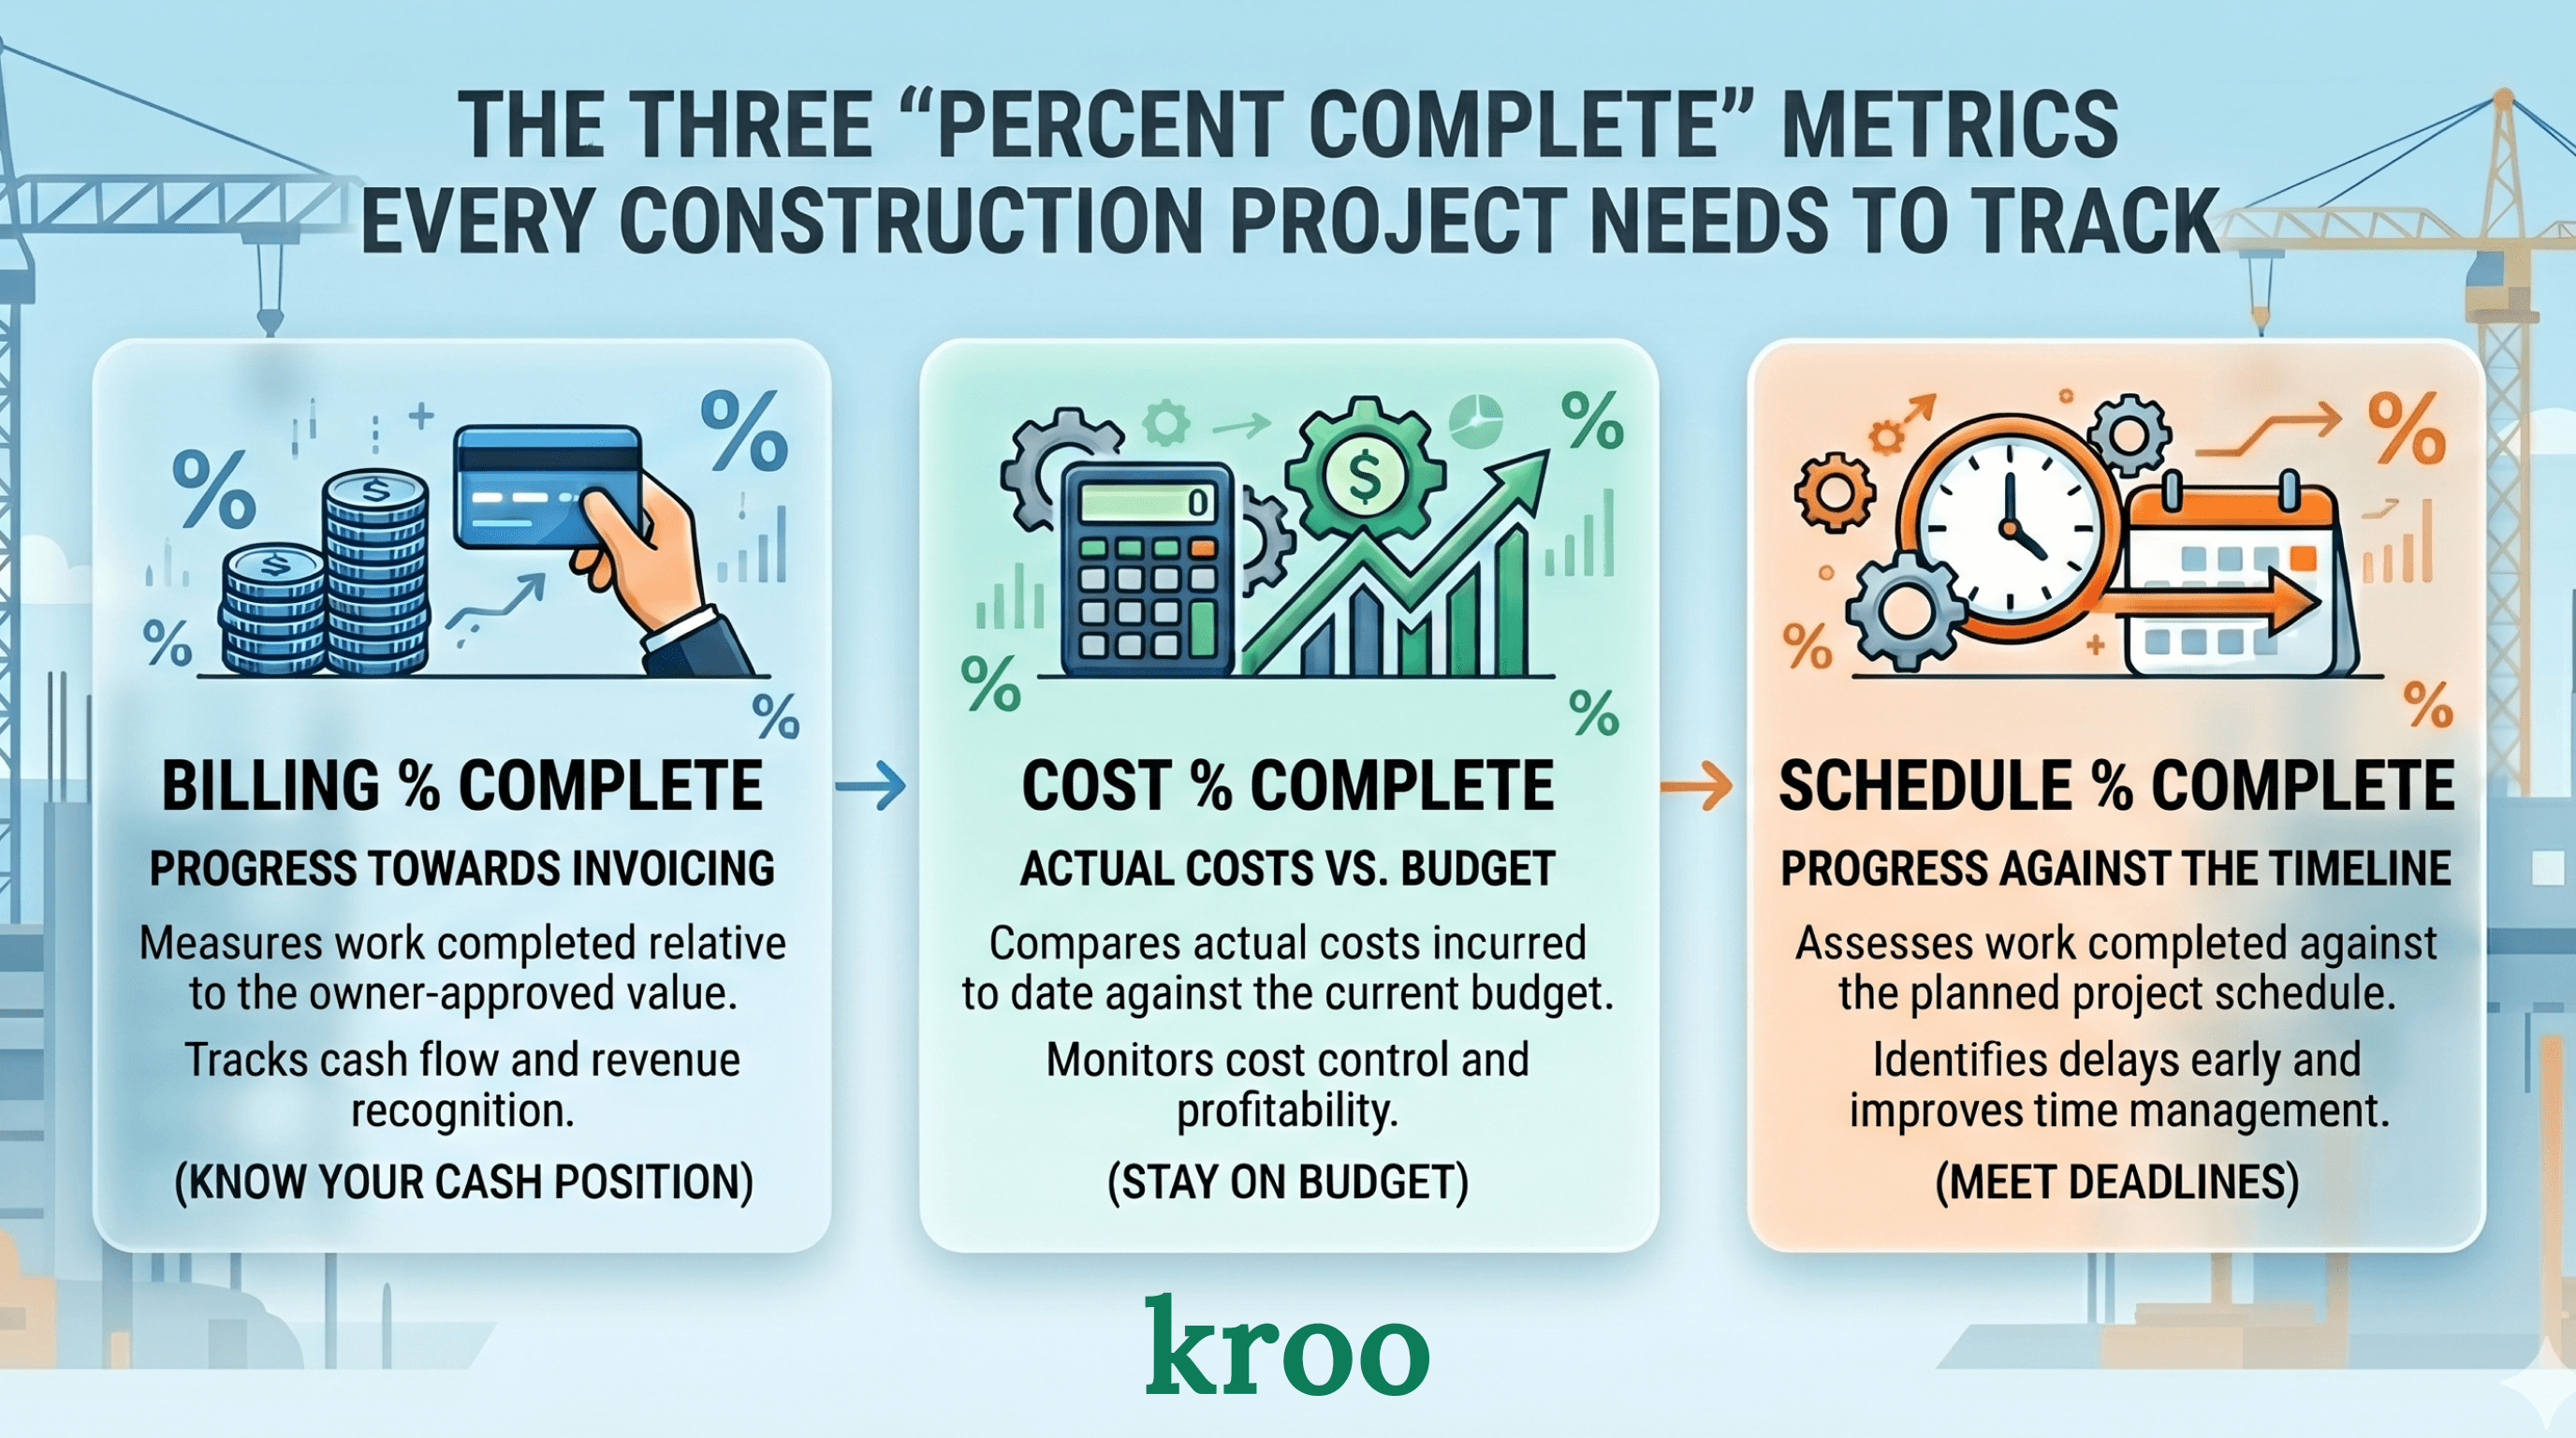
Billing percent complete is the simplest one. It is how much of the contract value has been invoiced to the owner. If you have a $10 million dollar job and you have billed $4 million, your billing percent complete is 40%.
Cost percent complete is how much of the projected total cost has already been spent and paid for. If your estimated cost at completion is $8 million and you have spent $4 million, your cost percent complete is 50%.
Schedule percent complete is how far through the project timeline you are. If the job is scheduled to run twelve months and you are six months in, your schedule percent complete is 50%.
Three numbers. Each one tells you something different. Together, they tell you almost everything and serve as useful leading indicators for project performance.
What it looks like when they are aligned
On a well-running job, these three numbers stay reasonably close to each other. If you are six months into a twelve-month job, you would expect to be roughly halfway billed, roughly halfway through your projected costs, and roughly on schedule.
They will never be perfectly equal. Different phases of a job have different billing frequencies and different cost profiles. But they should be in the same neighborhood. When they are, the job is healthy.
What it looks like when they diverge
This is where the real value is by tracking these three "percent complete" numbers. When the three numbers drift apart, something is off. Here are the most common patterns and what they mean.
Cost is ahead of billing. Your cost percent complete is significantly higher than your billing percent complete. You are spending money faster than you are getting paid for it. This happens when a project is behind on pay applications, when billing is lagging the work being done, or when costs are running over budget on sections you have not yet billed for. Left unaddressed, this creates a cash crunch. Perhaps there needs to be a conversation with the owner if pay apps are being delayed.
Cost is ahead of schedule. Let's imagine you are halfway through the projected timeline, but you have spent more than half of your projected total cost. This is one of the clearest early warnings of a job that is going to overrun. Either the cost estimate was wrong, productivity is lower than expected, or something unexpected happened that has not been reflected in the updated cost forecast yet.
Billing is ahead of cost. This seems like a good thing at first glance, and sometimes it is. But it can also indicate that billings are being pushed ahead of actual work to improve cash flow, which creates risk at the end of the job when the work is done but the billing is largely already collected. Some owners and lenders pay close attention to this pattern.
Schedule is far ahead of cost and billing. The job is more complete than the money suggests. This often happens when a project enters its final stretch where punch list and closeout work move slowly but the bulk of the cost and billing happened earlier. Not necessarily a problem, but worth understanding.
All three are low and not moving. The job has stalled. Work, billing, and cost are all behind where they should be for this point in the schedule. This is usually the earliest sign that a project is in serious trouble.
Why comparing these three numbers matters more than any one of them alone
Each of these numbers individually can look fine while the situation is not.
A project with 60% billing looks healthy until you realize cost percent compete is already at 85% and the schedule is only 55% complete. Now the picture changes completely. You are behind schedule, you have already spent most of your budget, and you are going to run out of money before you run out of work because your billables are behind schedule.
The same three numbers taken in isolation would each seem unremarkable. Together, they describe a project that is almost certainly headed toward a loss.
How to use this in a project review
The most practical application is a simple table or set of consecutive cards on a dashboard showing all three percent complete figures for every active job.
Jobs where the numbers are close get a green flag. Jobs where cost is more than ten points ahead of billing get a yellow flag. Jobs where cost is more than ten points ahead of schedule get a yellow flag. Jobs with multiple flags get a red flag and a conversation in the next project review. Leverage simple "red-yellow-green" colors to make it super simple for reviewing jobs.
This is project management by exception. You are not spending forty-five minutes on every job. You are spending thirty seconds on the healthy ones and your actual time on the ones that need attention.
The jobs that surprise you at the end are always the ones that were showing divergence three months earlier. The goal is to make that divergence visible while there is still time to do something about it.
What you need to make this work
The billing percent complete comes from your billing data in your project management software or ERP. The cost percent complete requires a current cost at completion estimate, which means your project managers need to be updating their forecasts regularly, not just at month-end. The schedule percent complete either comes from your scheduling software or from a manually maintained field in your ERP. Or from your project management software.
All three of these data points need to be stored in the same place for the comparison to work. If billing lives in one system, cost in another, and schedule is a PDF somewhere on a shared drive, you cannot run this analysis without significant manual work and someone stitching numbers together over and over.
This is one of the clearest arguments for investing in a data warehouse. Not because data warehouses are interesting technology, but because without one, this specific comparison takes someone half a day to put together manually every month (or every week). With one, it updates every night and lands in a dashboard that takes thirty seconds to scan. At Kroo, we help provide managed data warehouses to all of our customers which unify their different data coming from various software.
The three percent completes are not a complex concept. They are three numbers that any project manager understands immediately. The hard part is having the proper data infrastructure to see all three, for every job, in the same place at the same time.
A note on the cost at completion estimate
The accuracy of the cost percent complete depends entirely on whether the projected total cost is realistic.
If a project manager's forecasted cost at completion is always exactly equal to the original budget regardless of what has happened on the job, the cost percent complete is meaningless. It becomes a number that tracks budget consumption rather than actual project performance.
The forecasted cost at completion should reflect the project manager's honest current estimate of what it is actually going to cost to finish the job. When that number is kept current and honest, the cost percent complete becomes one of the most powerful indicators in your entire reporting stack.
Getting project managers to update their forecasts honestly is partly a culture question and partly a process question. But it starts with making those forecasts visible in a way that creates accountability. When the CFO can see the forecasted cost at completion for every active job, updated every week, the quality of those estimates tends to improve.
Want better visibility into project health across your portfolio? Let's chat.
Request a Demo